
Still need help?

Tables let you arrange multiple fields side by side in rows and columns, similar to how data is represented in spreadsheets.
This feature is especially useful when you want to capture repetitive but structured data in a compact format.
UseCase
To insert a table into your app, go to Design App and click on Add Table (next to Add Section).

A new table will appear in the app layout with two columns added by default. These are placeholders and can be changed based on your needs.
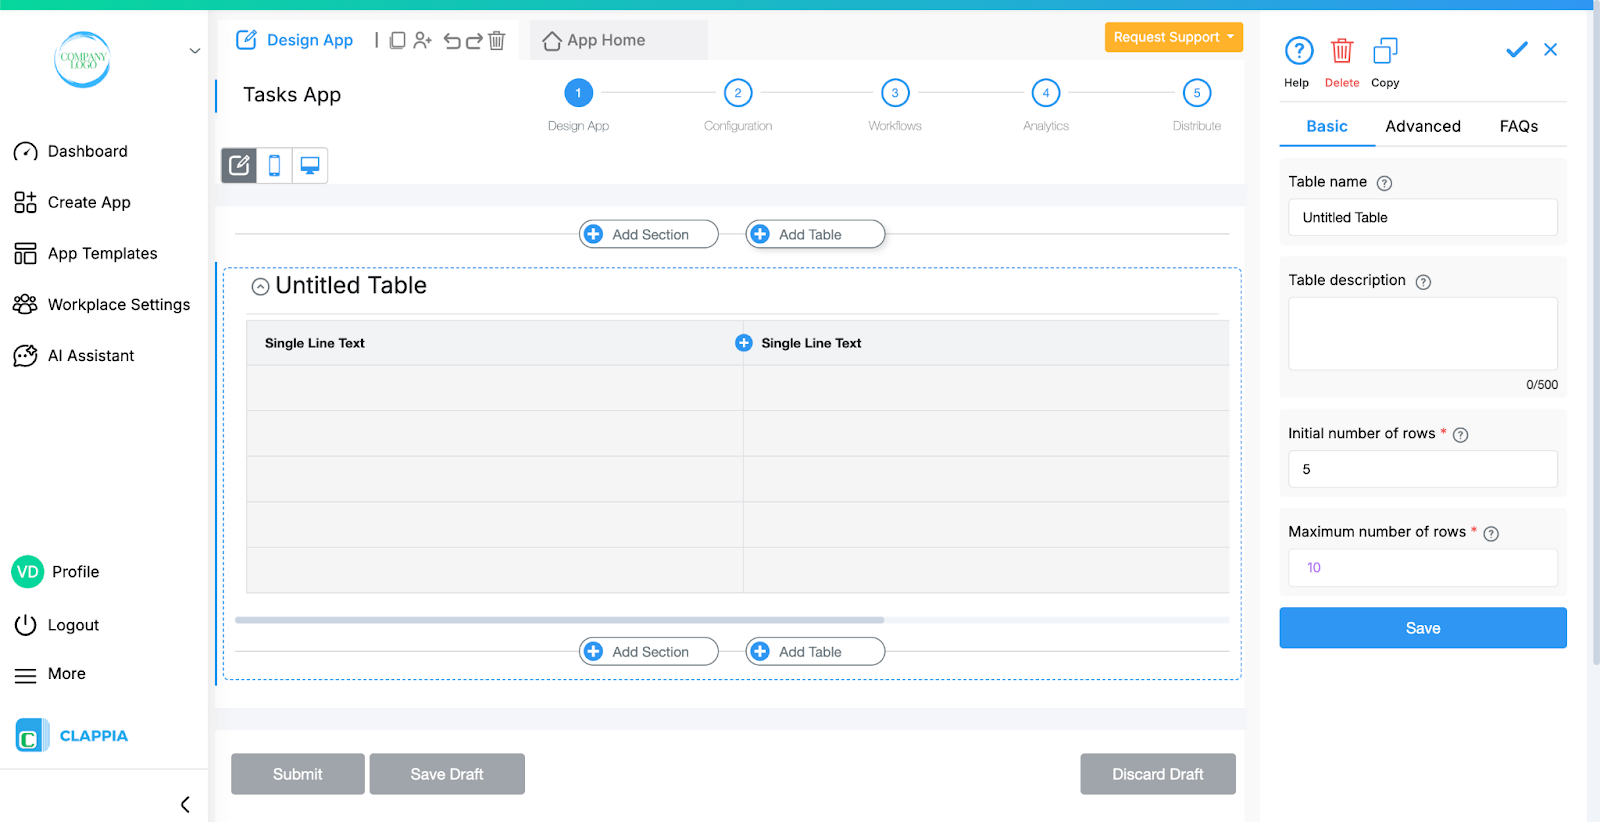
Each column of a table is essentially a field. Currently, only certain field types are supported as columns (Single Line Text, Number Input, URL Input, Email Input, Dropdown, Date Selector, Ratings, Toggle, Counter, Calculations & Logic).

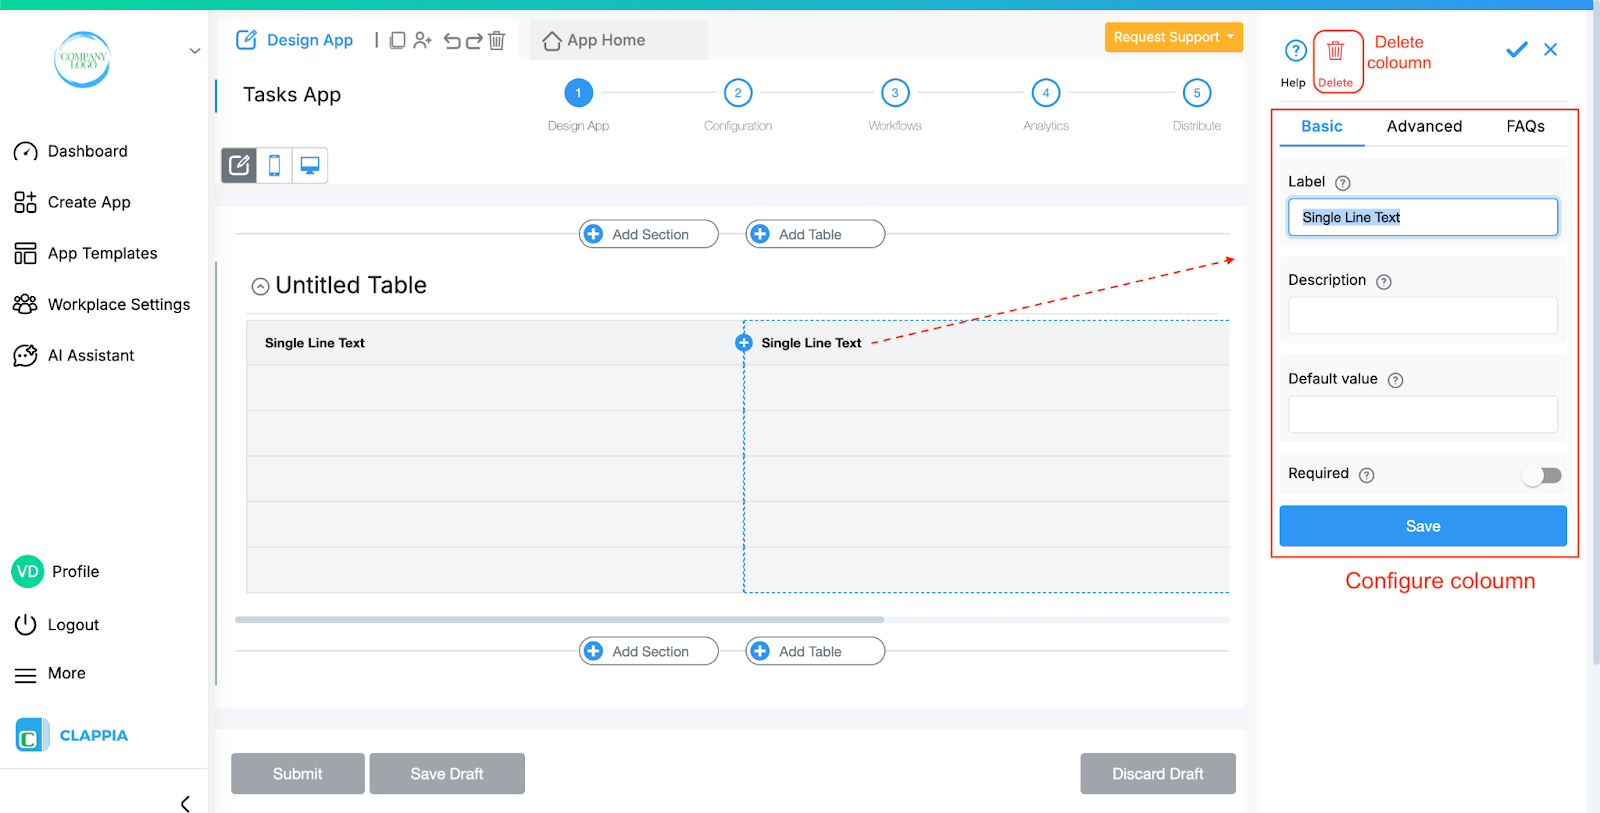
This makes each column behave like its own field, but structured within a table.
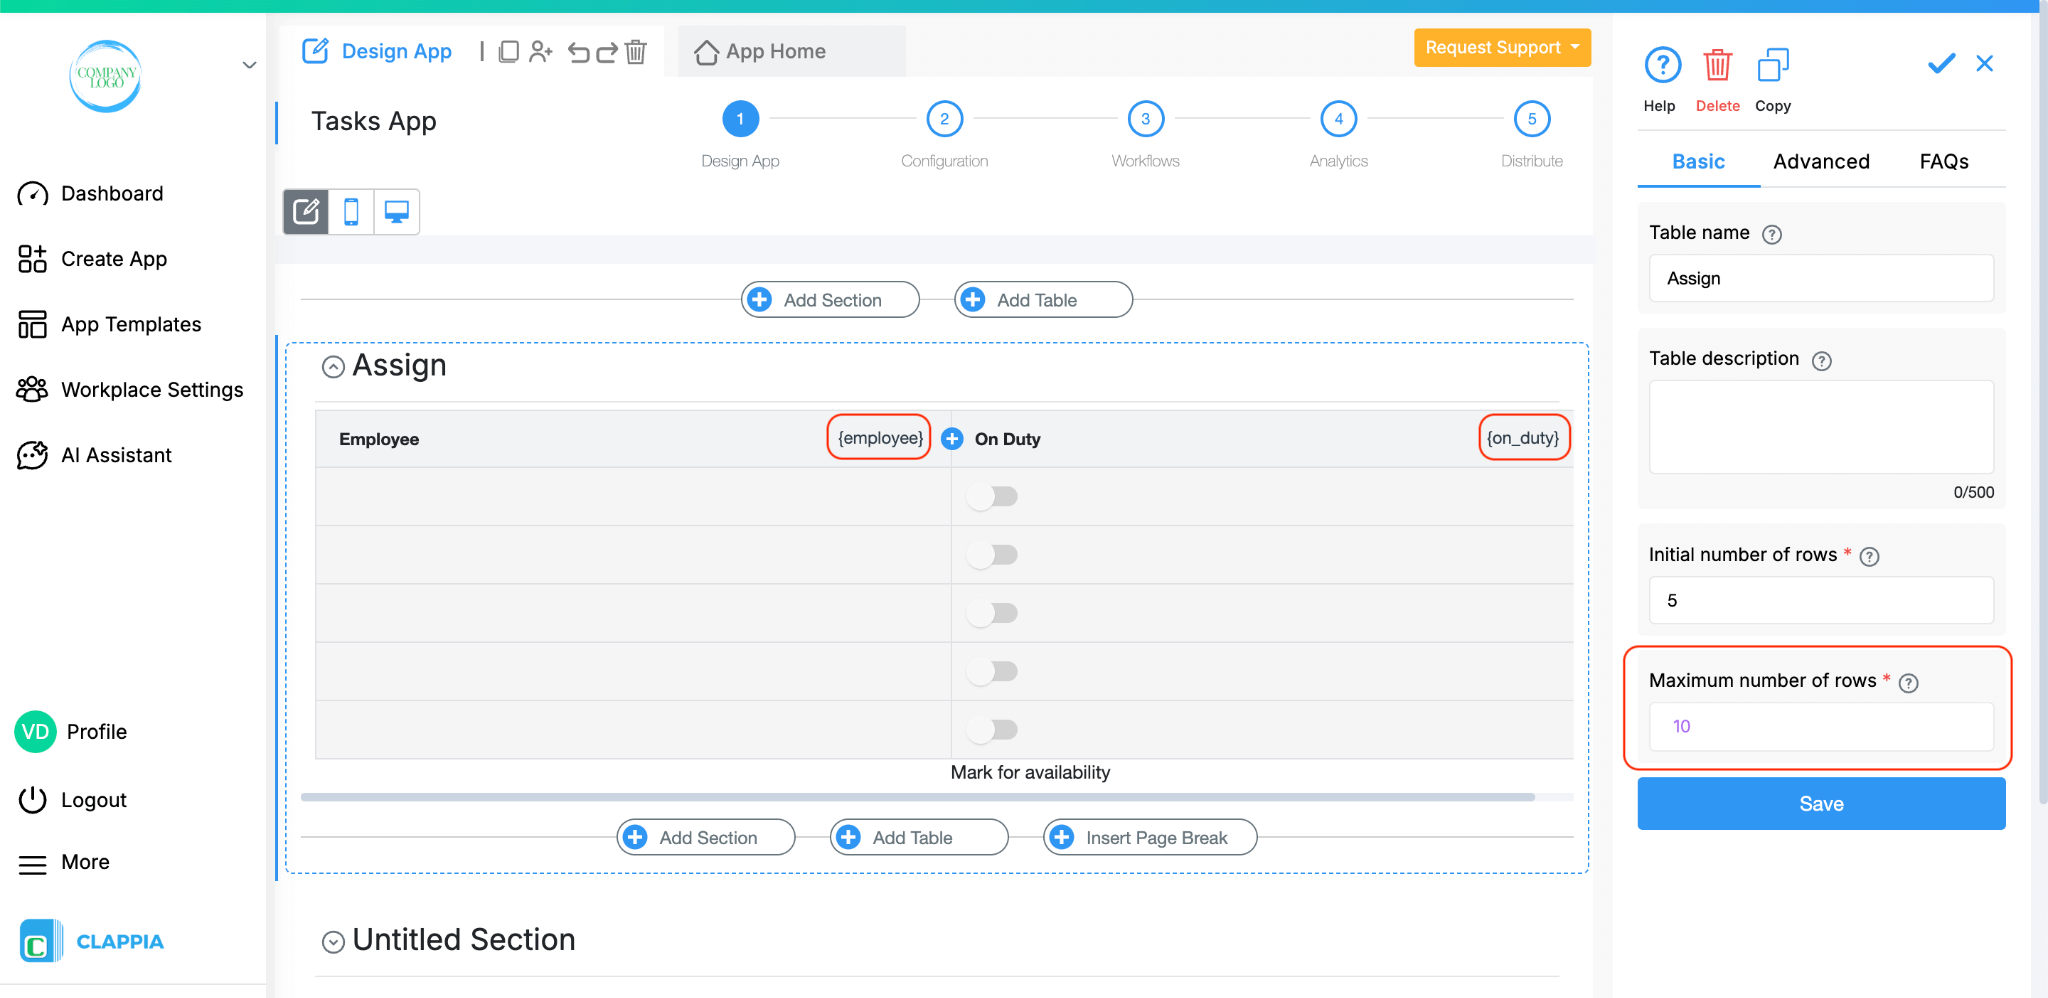
When you select the table section in the app builder, you can configure it on the right panel that appears.

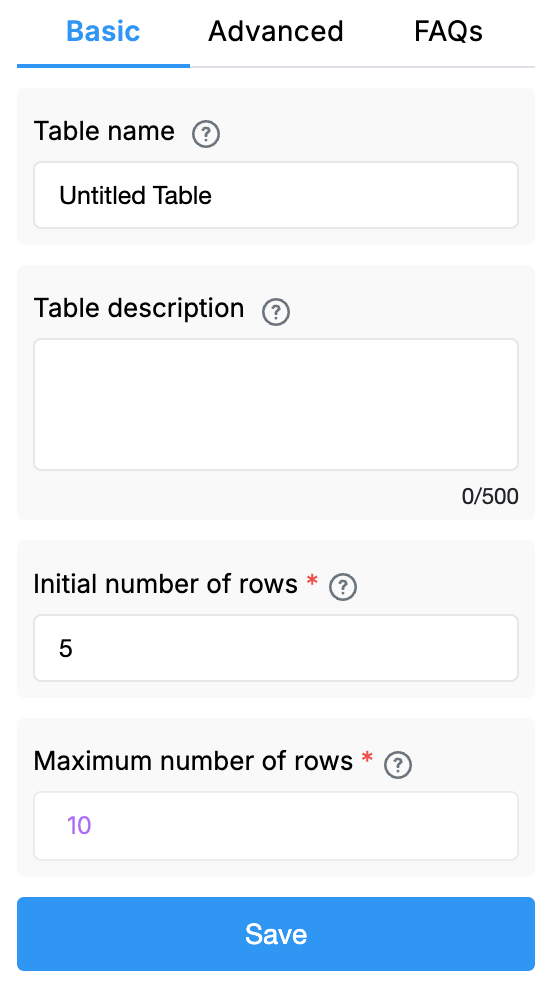
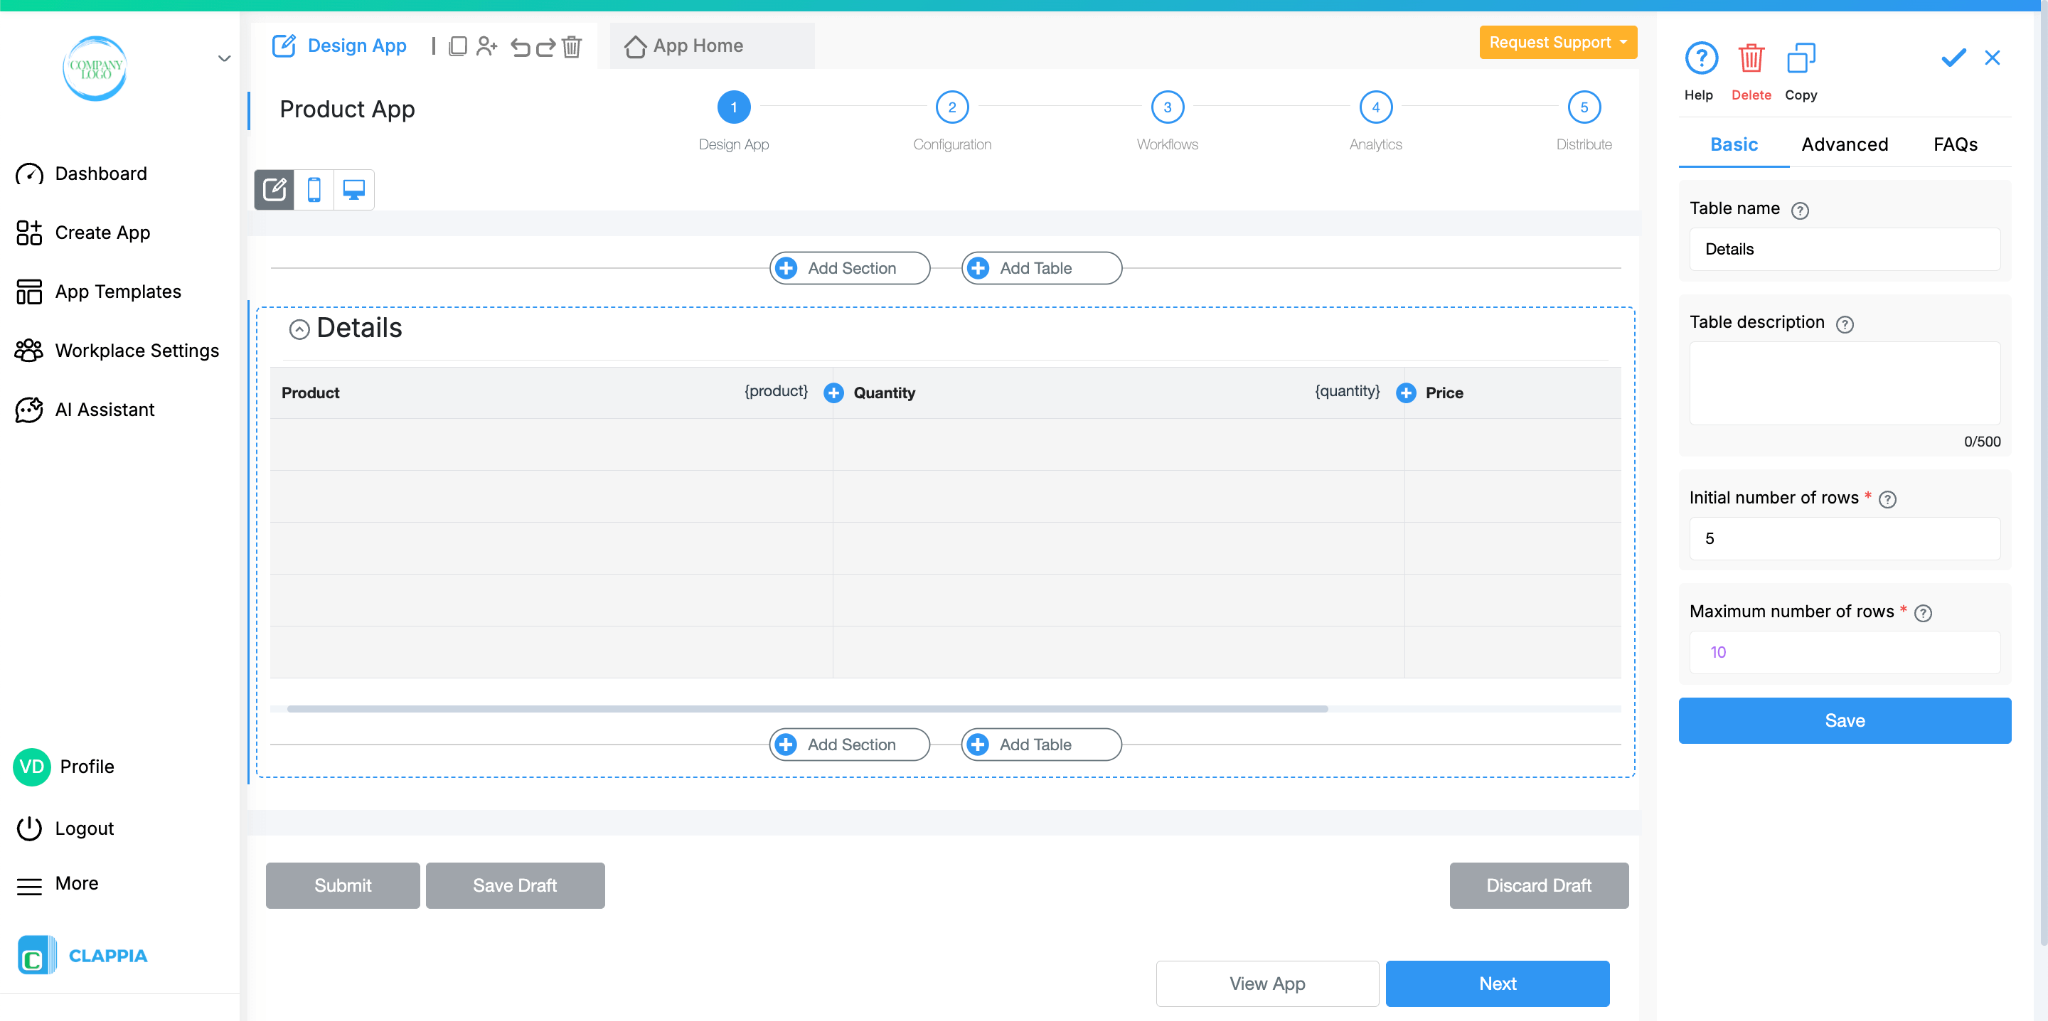
Table Name
This is the title that will appear above the table when users see it in the app.
Table Description
An optional note you can write below the title, usually to guide users on what they should fill in this table.
Initial Number of Rows
Define how many rows will be displayed when the table is first opened (in the web app only). For example, if you set it to 5, the user will immediately see 5 rows ready to be filled.
Maximum Number of Rows
Set the maximum rows that can be added by users. Users can add more rows until this limit is reached by clicking “Add another row.”

Display this Table If
Use this option to show or hide the table under specific conditions. It accepts the standard Clappia formulae, similar to conditional sections or in the ‘Calculations & Logic’ block.

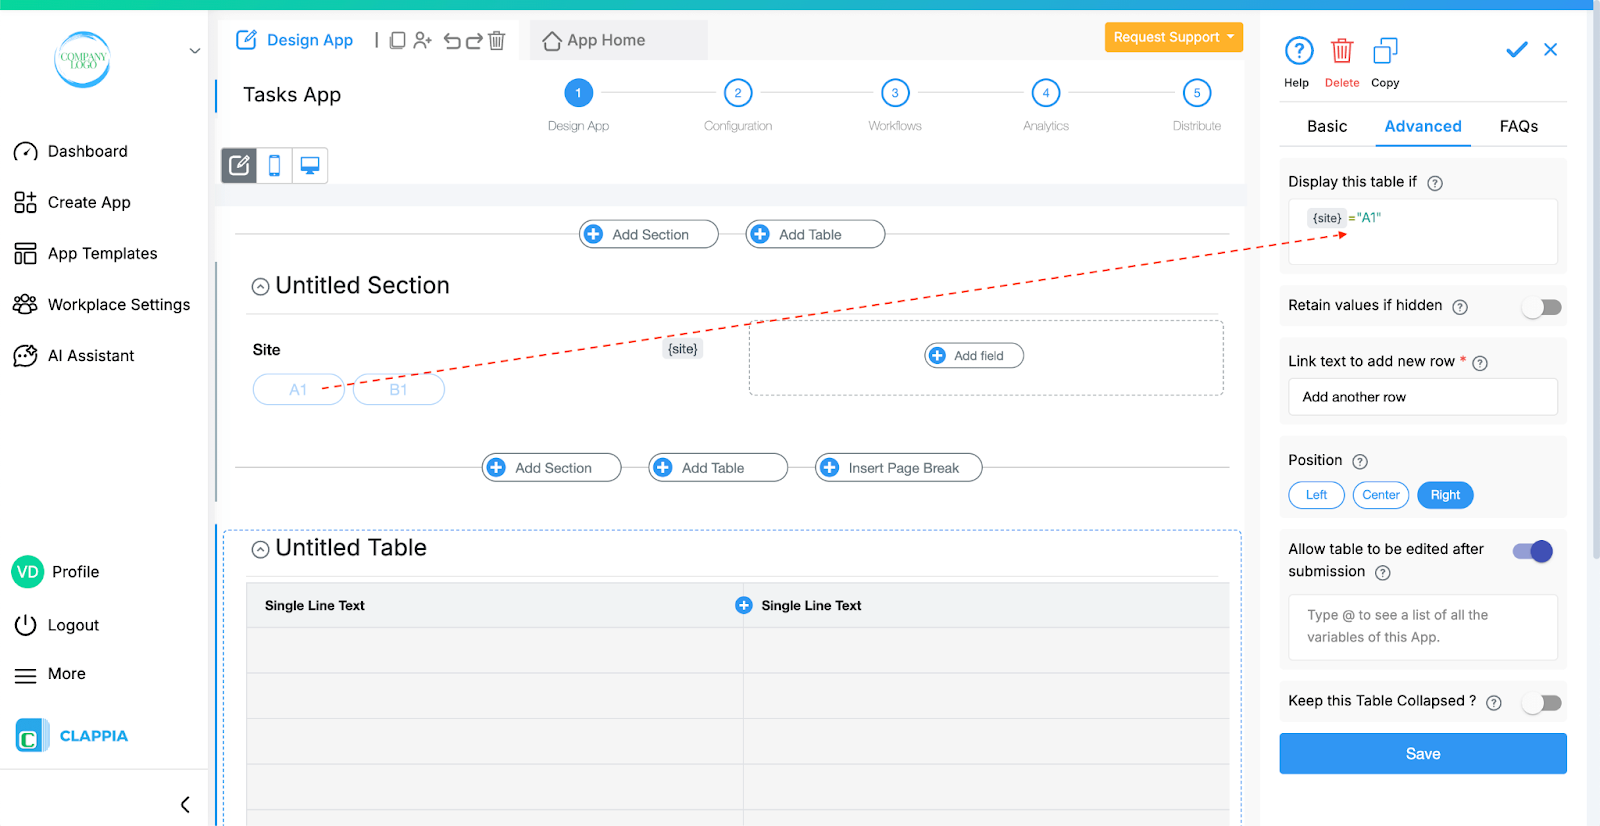
Retain value if hidden
This option appears once a condition is set in the Display this table if option. Enable this setting if you want the field's value to be retained even when the table is hidden. This is useful for preserving user input in cases where the field may temporarily disappear based on conditions.

Link Text to Add New Row
Customise the text that users will see when they want to add another row. For example, you can change it from “Add another row” to “Add another expense.”
Position
Choose whether the table heading is aligned to the left, centre, or right.
Allow Table to be Edited After Submission
This option is enabled by default. When active, end users can edit the table after creating a submission in the Submissions tab.
You can also give in conditions based on other field values to allow editing. Simply type in @ followed by a field name and give a condition.
Disable this option if you want the initial email to remain unchangeable once submitted.
Keep this Table Collapsed
If enabled, the table will remain collapsed by default when the form opens, and users can expand it when they want to add data.
On the Web App (App Home)

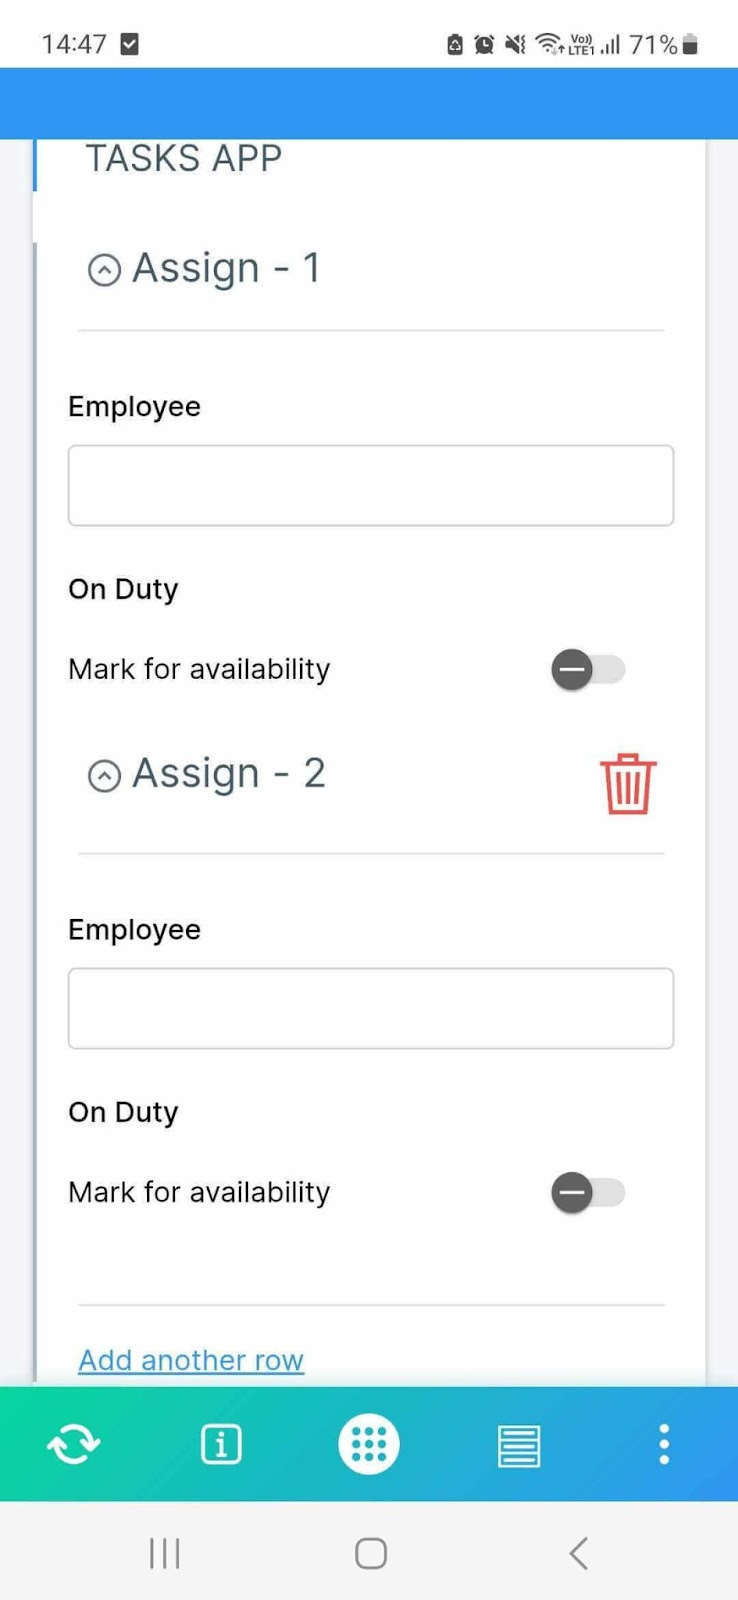
Users see the table with fields arranged in rows and columns. They can type into cells, delete unused rows, and add new rows (up to the maximum limit set) by clicking the “Add another row” link.
On the Mobile App

Tables do not appear in grid form. Instead, they show as a sequence of fields, and new rows can be added by tapping “Add another row.”
This behaves similarly to copyable sections, but instead of duplicating sections, it adds new rows to the table’s fields.
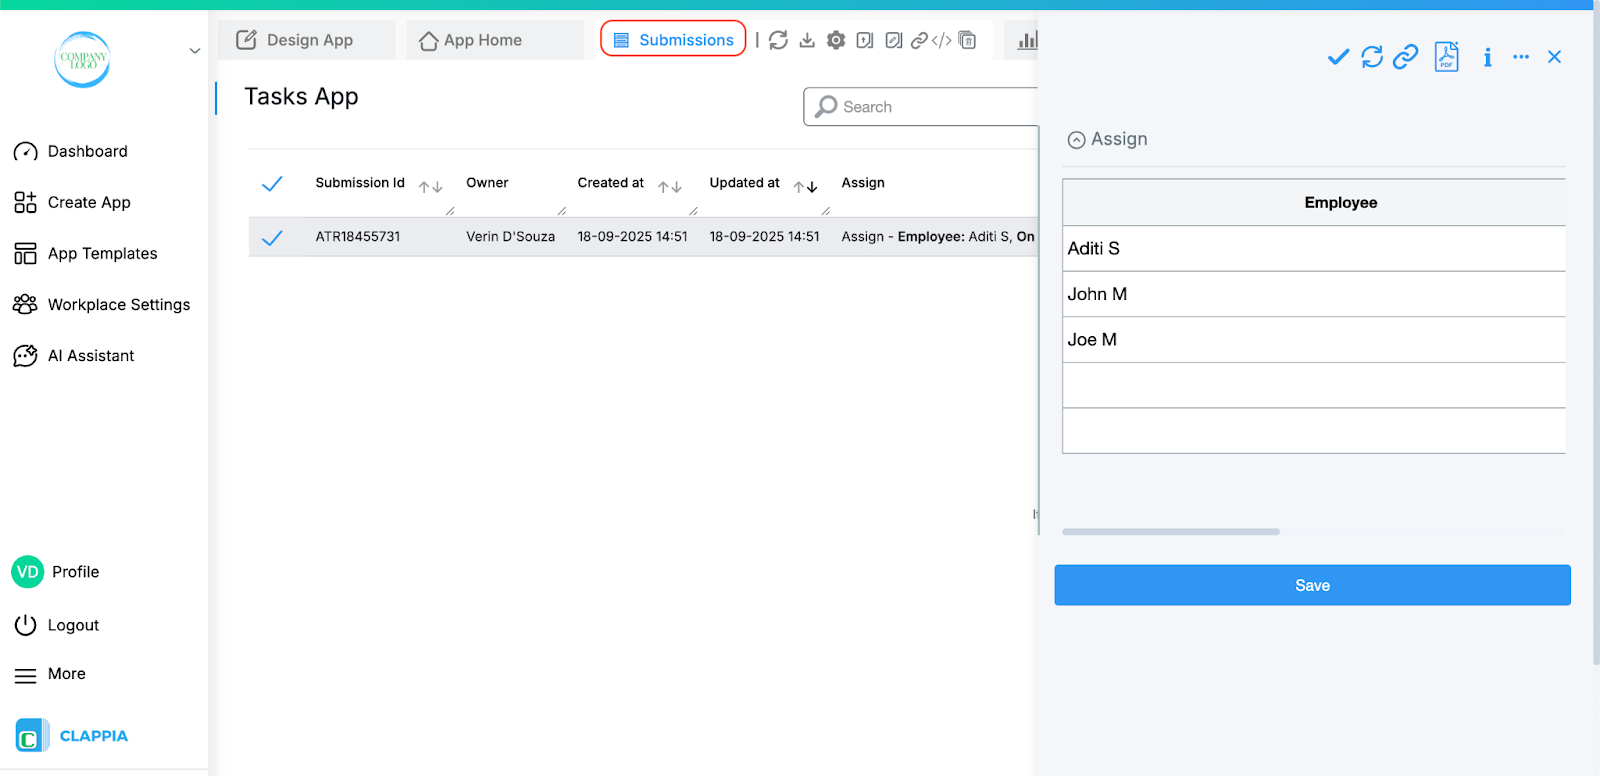
When you open a submission from the Submissions tab, the table data appears as is, however, in the submission table, the data from the table appears in a combined format, similar to how copyable sections are displayed.
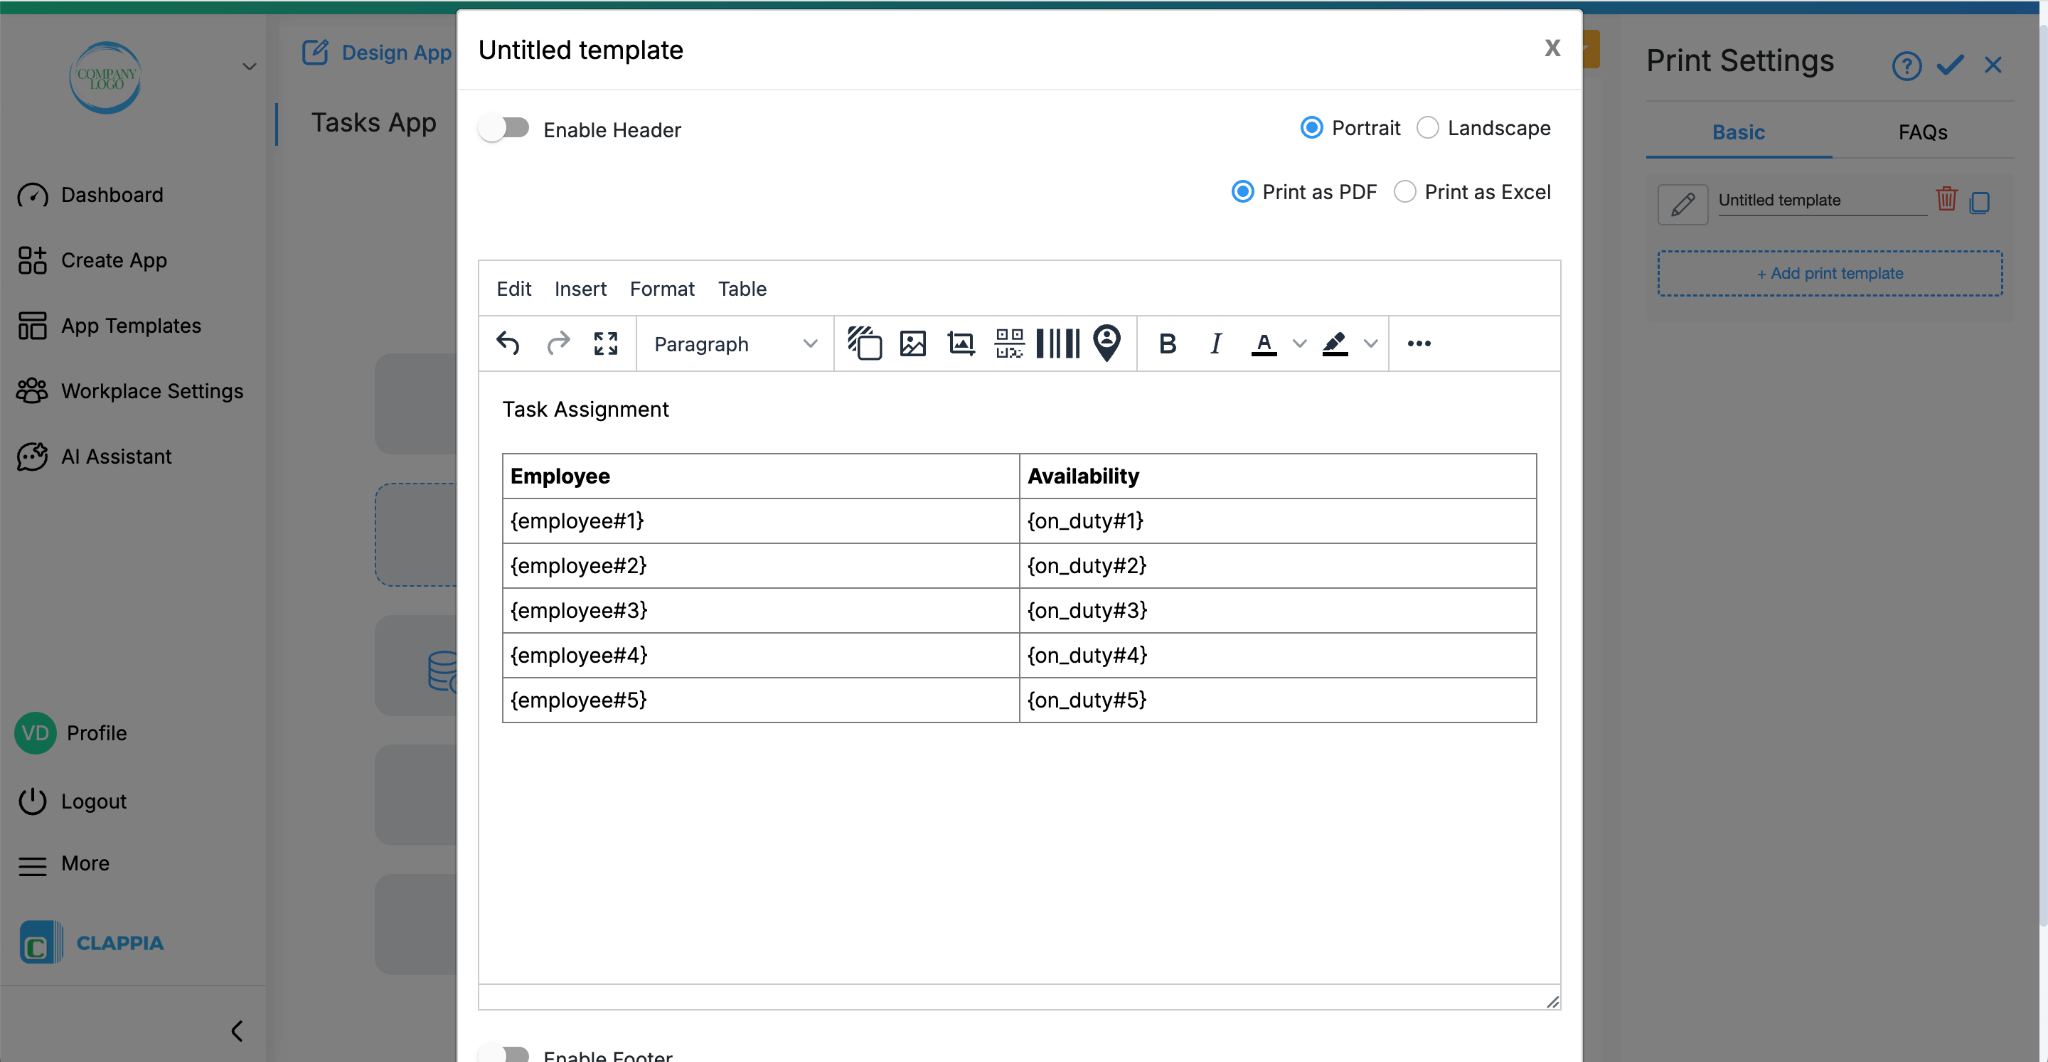
Each column in a table is treated like an individual field, and Clappia automatically creates variables for them. You can use these variables when designing your PDF documents in Print Settings.
When the table is created, make sure you save the table as well as the individual columns. Then a variable is generated for each column.
To pull values of an individual cell, the variables will include an index number. For example, if the maximum number of rows is set to 10, then 10 indexed variables will be available for each column.

This means you can pull values row by row when generating your PDF. If some rows are unused, those variables will remain empty.
Tip: Add a table element in your print settings and insert the table’s variables into it. This way, if some rows are empty, you can easily delete them in the PDF template, ensuring a clean layout.
To delete empty rows in a table, select the table > click on ‘Table’ option > Table properties. A pop up window will appear. Go to General > Class > Delete empty rows.

Tables allow you to use special functions that can calculate or combine values across all rows. These are especially useful when you want to total numbers, count rows, or join text together. Essentially, tables behave like copyable sections in Clappia. This means that the same functions that are commonly used with copyable sections can also be applied to tables. These functions allow you to work with data across multiple rows in a table, instead of only looking at single cells.
To understand this better, let’s say you have a table with three columns: Product, Quantity, and Price. Users can add multiple rows, each row representing one product entry. Now let’s see how different functions can be applied to this table.
Count
The Count function tells you how many rows are currently filled in the table.

For example, if a user adds 5 rows of product entries, the Count function will return 5.
COUNT({product})

This is useful when you need to know how many items have been recorded, regardless of what the actual data is.
Sigma
The Sigma function is used when you want to calculate the total of values across all rows in a numeric column.
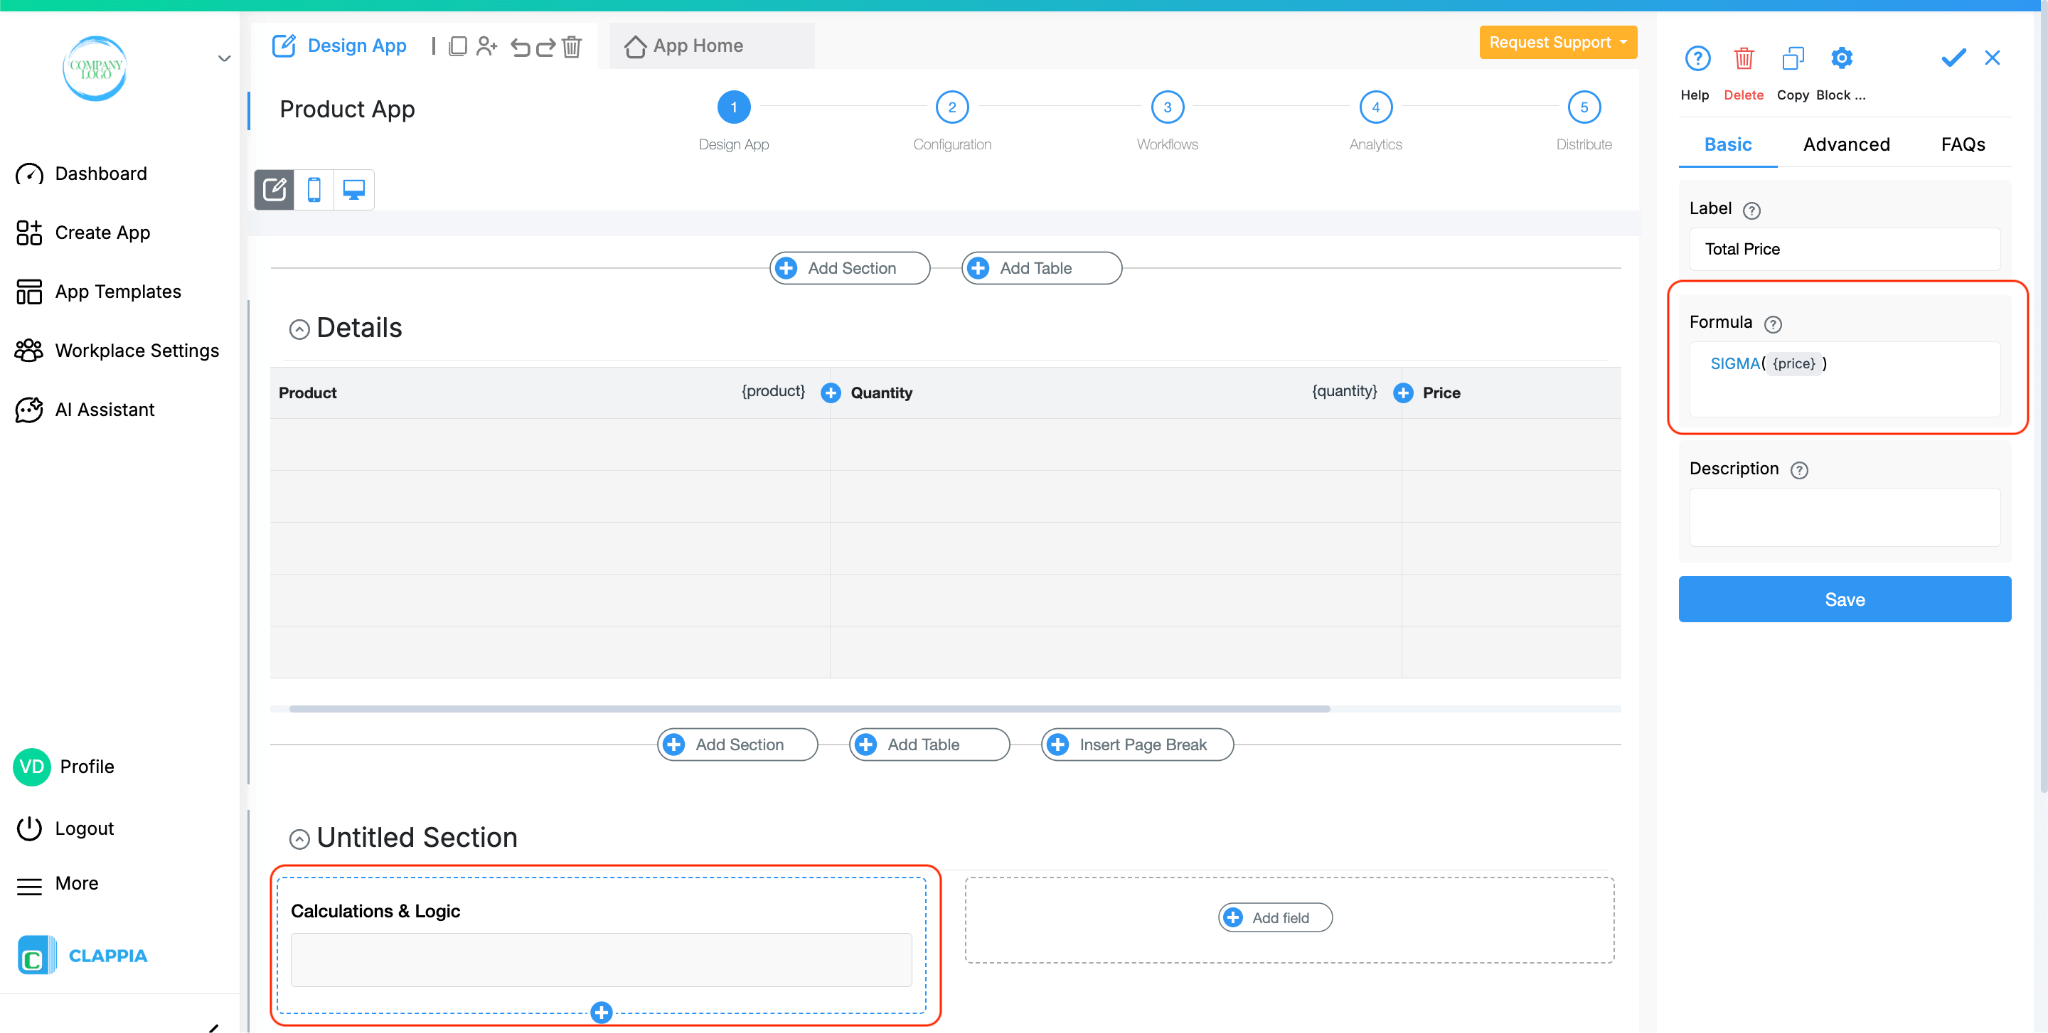
For example, if the table has a Price column and users enter prices for different products, the Sigma function can add them together to give the total price of all products combined.
SIGMA({price})

This is especially useful for things like expense reports, order totals, or any situation where numbers across rows need to be summed up.
Join
The Join function takes the values from a column across all rows and combines them into one text string. You can also choose what separator to use (like a comma, space, or hyphen).

For example, if a user enters three products — “Table,” “Chair,” and “Lamp” — in the Product column, the Join function can bring them together as “Table, Chair, Lamp.”
JOIN(“,”,{product})

This is helpful when you want to display or export a quick summary of all values in a single line.
Index
The Index function is used to pull out the value from a specific row in a table.

For example, if you want to get the Price from the second row only, you can use the Index function on the Price column with row number 2. This way, you don’t always have to work with the entire table, you can directly target individual rows if needed.
INDEX({product}, 1)

Together, these functions give you flexibility to calculate totals, count rows, join text, or fetch values from specific rows. They are especially powerful when used in formulas inside a Calculations & Logic field, where you can mix them with other conditions to create customised outputs.
Q: Why am I not able to see the different row variables when configuring Print Settings?
Possibility:
Sometimes the browser may be showing cached data, which prevents the latest variables from loading correctly.
What to do:
Go to your browser settings and clear the cache. Once the cache is cleared, return to Print Settings and check again — the row variables should now appear.If they still do not show up, you can raise a support request with the Clappia team for further assistance.

L374, 1st Floor, 5th Main Rd, Sector 6, HSR Layout, Bengaluru, Karnataka 560102, India

3500 S DuPont Hwy, Dover,
Kent 19901, Delaware, USA


3500 S DuPont Hwy, Dover,
Kent 19901, Delaware, USA
L374, 1st Floor, 5th Main Rd, Sector 6, HSR Layout, Bengaluru, Karnataka 560102, India
.svg)
